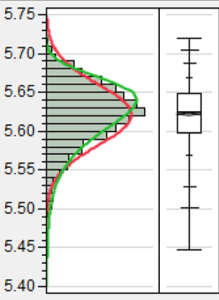
A bar chart representing a frequency distribution where the lengths of the bars represent the observed frequencies. Often paired with a box plot. The left graph in the figure here.
See also: box plot

A common graphical tool for studying random variables.
A bar chart representing a frequency distribution where the lengths of the bars represent the observed frequencies. Often paired with a box plot. The left graph in the figure here.
See also: box plot