
A graph of the output of a statistical decision (usually the likelihood the test is passed) versus the quality present in the sample (usually the level of non-conforming product produced by the process). It shows visually the chances of both a type I error and a type II error from the test.
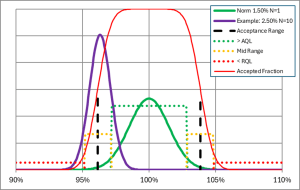
Warning: there is no standard format for graphing the operating characteristic curve. Depending on the choice of axes the identical test performance can look very different visually.