
I just finished watching a course delivered by Chad Orzel on Einstein’s Legacy [1]. It was fascinating to me, as I find many of these courses. In particular the last episode touched on many issues I plan to discuss here in my Articles section, so I figure this is a great place to start my writing.
The last episode focused on quantum cryptography and particle entanglement. Both interesting topics on their own, and a key discussion point in the course was Einstein’s rejection of the statistical model of nature described by quantum mechanics—he preferred the “hidden variable” hypothesis. This objection was originally stated in his 1935 paper (together with Podolsky and Rosen), and often called the “EPR objection” or “EPR paradox” [2].
1. Einstein was wrong
Einstein’s view here was not well received at the time of publication, but it would be about 30 years before the issue would be closed. Bell’s work [3] in the 1960’s and later experimental confirmation would clearly support the statistical description of quantum mechanics. So Einstein was indeed wrong here.

Really, though, this just says he is human—aren’t we all wrong some of the time? After noting this was not the only mistake made by Einstein, Orzel suggested that the quality of this mistake actually highlights Einstein’s true brilliance, noting that “with the EPR paper, Einstein was not merely boringly incorrect but [instead] brilliantly wrong.”
Now I aspire that when I inevitably go awry to never be boringly incorrect—only brilliantly wrong! Which brings me to my goals for these articles. Primarily I will share my passion for statistics (yes, I know this is weird). I hope to offer a bit of entertainment as I connect statistics to the “real world”. And in time I hope to fully share the key tools for statistical decision making that I have found useful over the years.
Where to start then? Well, every statistical decision starts with classifying your observations—and some of those outcomes are actually boring, so we will need to start there. First, though, let me attempt to define a “statistical decision.”
2. What is a “statistical decision”?
If you Google this you will find lots of pages talking about inference, hypothesis testing, Bayes’ theorem, and more math than you may care to process. This is a general problem when learning statistics and is still an issue in my view—sometimes we make things too complicated (more generally I find this is true of most quality tools and “Quality” in general). Hopefully I can help fill a bit of this gap for people that may be following a path similar to mine.
So let me give a go at this from my perspective: a statistical decision is the result of the process attempting to correctly classify some system event into a category based on a series of observations. We will see (and perhaps you already have) that statistical decisions can go wrong in any of these four key areas. Breaking each area down separately:
- The event is observable more than once, possibly requiring a reset of the system before each observation.
- The observation relates to the categories of interest and the event tends to yield different observations for the different categories of interest.
- There is a process for the classification that produces a specific decision as the result of the observations (e.g., “take an average and compare it to a reference value”).
- There is a true classification for the event, independent of our observations (though in some cases we may never know what that correct classification is).
Now I must apologize to those giants who have stood before me in this field—for I see this initial definition is more complicated than anticipated. I guess this foundational work is more subtle in the details than I have been giving it credit for!
Perhaps for clarity we should look at a comparison between a “regular decision” and a “statistical decision”. Regular decisions are the vast majority of decisions we make in life, many without thinking and almost all without any recourse to mathematics of any sort. On the points of definition above:
- Regular decisions are based on observable events, but there may be no expectation or awareness that the events may be part of a repeating pattern. Also, spontaneous regular decisions may only be connected to an apparently causal event in hindsight.
- Regular decisions also yield a category choice, but in many cases the choice is one of “satisficing” (picking the first plausibly acceptable category) rather than a careful review of all possible category outcomes.
- Regular decisions will follow a process, but this process may be unknown, untested, miss-applied, or any of the other numerous process failures we see in life.
- Regular decisions may, or may not, have a strictly true classification result. Most decisions in your life, frankly, will not have a result that is independently true. This is obvious once you appreciate how many decisions come down to “matters of taste” or choices in your “pursuit of happiness.”
So, while not as simple as I might wish, it is clear that a statistical decision is a specific subset of general decision-making. It is in no way a “regular” decision, but instead is a structured and repeatable process that can be clearly defined, assessed, and improved.
Statistical decisions come up all the time in business. In good manufacturing processes, almost every control or check point will involve a statistical decision. Examples will include in-process controls, batch release tests, and verification of process changes. I should note here that this comment applies to all good manufacturing processes—in a regulated industry or otherwise. Elsewhere in business, we might find statistical decisions directly in questions of finances or staffing utilization (where appropriate) or we will sometimes recast a regular decision as a statistical decision (e.g., building a weighted-matrix SWOT analysis to help the team assess a strategic decision).
Every statistical decision problem we encounter in the real world will be different in many ways. Gathering good observations is often tricky, as is identifying and describing the categories of interest. The process will depend strongly on not just these two factors, but also on the question we are asking that lead us to define the categories. Finally, of course, the decision we make might either agree or not agree with the true classification.
3. A general classification from interesting to boring
To be concrete, then, let’s build a general classification table for a statistical decision. This will be a 2×2 matrix to keep it simple, comparing the decision we make with the true classification as shown in the figure here. It may look like a variation of the Boston Box decision tool, but the grid here is specifically adapted for the stastical decision we need to make. I have put the “statistical decision” across the top as column headers, and the “true state of nature” on the left as row headers but there is no great importance to this decision—you will see that other authors may swap this convention.
Later we will add some math to this table, but for now it is only important to understand its structure. The basic decision we are seeking is to categorize if there is an Effect (ℰ), or if there is No Effect (ℵ). After making our observations and running whatever process we came up with, we make a decision that either the effect is present (E) or it is not present (N). Given we may not know the true state of nature, this leaves us with the four possible outcomes shown in the figure.
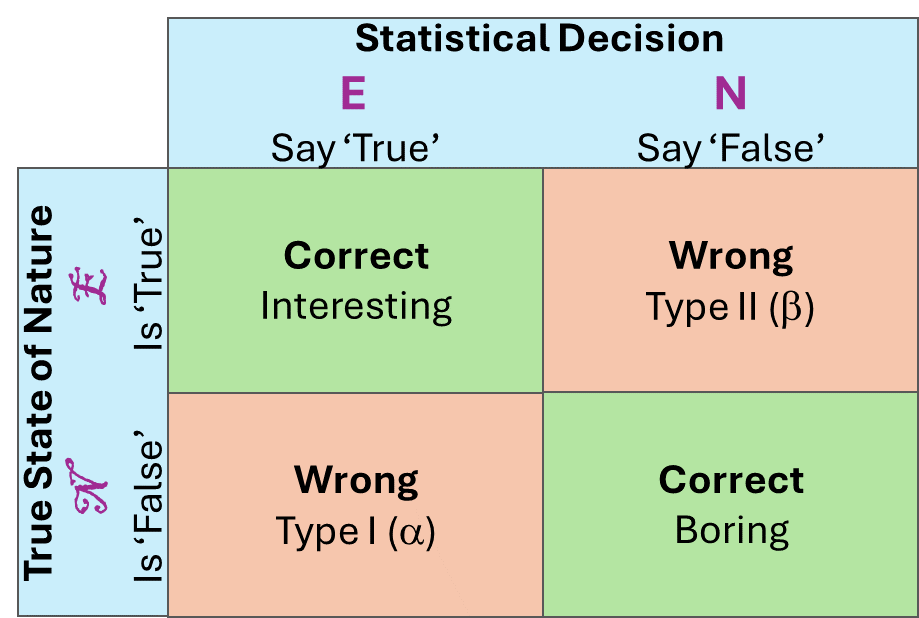
Let’s briefly cover the four possible outcomes of the statistical decision.
The top left is the most interesting outcome: our process identified there is an effect present, and this is in agreement with the true state of nature. Fantastic! This is typically the category we are looking for when filtering by the statistical decision process. For example, we may be using a diagnostic test to see if you have a disease, or running an in-process control to ensure your manufacturing system is still producing quality products.
Continuing to the bottom left we see the mistake most people recognize in a statistical decision: the Type I error, or “significance” (usually represented by α). This error happens when my decision is that the Effect is present, but unfortunately the true state of nature is No Effect is present. This is a big problem for my decision making: I highlight something is happening, but when you then take a look it is quite possible you will (correctly) indicate there is indeed No Effect. For this reason, this error is sometimes referred to as “lost credibility.”
In the top right box we see the other mistake that can come from a statistical decision: the Type II error, or “power” (usually represented by β). This error happens when my decision is that No Effect is present, but unfortunately the true state of nature is there is an Effect present. This is a more nuanced problem for decision making: I don’t see something is happening and then probably move on elsewhere. Later, perhaps much later, you come back to this question and it is quite possible you will (correctly) indicate there is indeed an Effect present. For this reason, this error is sometimes referred to as “lost opportunity.” It may be fair to rate this as the less important error coming from a statistical decision, but too often we will see that this second type of error is either minimized or ignored.
Finally, in the bottom right corner we are correctly indicating that No Effect is present. We might, rightly so, be excited that our result is in agreement with the true state of nature. However, I label this as “boring” for three primary reasons:
- We don’t notice it, since it is not what we are looking for anyway. There is plenty of chaff to separate from the grain, and we are only looking for the grain.
- Even if we notice it, we will ignore it since the event will not be progressing forward in any follow-on work—my interest (if any) ends at this point.
- Finally, if we were to focus on this category we would find too many unrelated events that could fall into this bucket and there is a great potential for bias (or worse) if we put significant consideration onto these events.
We will discuss this boring scenario more in later articles, but for now it is enough to know it is best ignored, and we will usually arrange the statistical question such that the “interesting” result is less frequent than the “boring” result.
Thank you for reading this piece. Feel free to leave a comment or question below.
4. References
[1] Chad Orzel, “Einstein’s Legacy: Modern Physics All Around You”, The Great Courses / Wondrium (The Teaching Company, 2022).
[2] Einstein, A, B Podolsky, N Rosen, “Can Quantum-Mechanical Description of Physical Reality be Considered Complete?“, Physical Review 47 (10): 777–780 (1935).
[3] Bell, J. S. “On the Einstein Podolsky Rosen Paradox“, Physics 1 (3): 195–200 (1964).
Details
Version 1.0, First published 21 April 2025
Version 1.1, Published 20 June 2025, title change, minor format updates
Document reference: BUS-25-0070
Leave a Reply